Overview
This is an exercise in data analysis and visualization using the Baton Rouge Traffic Incidents dataset (retrieved on Jan 10, 2022).
- Explore Google Data Studio’s dynamic content
- Provide initial analysis of the dataset (using historical trends as reference)
Dictionary
These are some of the key metrics and terms that are abbreviated throughout the report:
- Incident (INT) refers to a singular report of traffic incident (or collision), identified by an incident number or ID;
- Incident with Injury (IIJ) refers to an INT with a reported injury;
- Incident with Fatality (IFT) refers to an INT with a reported fatality;
- Incidents with 2 or Less Vehicles (I2V-s) refers to an INT impacting 2 or less vehicles;
- Incidents with 3 or More Vehicles (I3V+s) refers to an INT impacting 3 or more vehicles;
- Vehicles or Vehicles Involved in an Incident (VIIs) refers to the total number of vehicles involved in an INT and is usually bucketed as either I2V-s or I3V+s;
- Primary Factors (P1Fs), Secondary Factors (S2Fs) refer to the factors that resulted to a collision, often a traffic violation; S2Fs may be null if there is no other identified collision factor besides the P1F
Dynamic Content
- Interactive Graphs. Each graph has been designed to produce dynamic content in response to user feedback. Each graph has a set of secondary (optional) metrics, and each page has a set of optional filters.
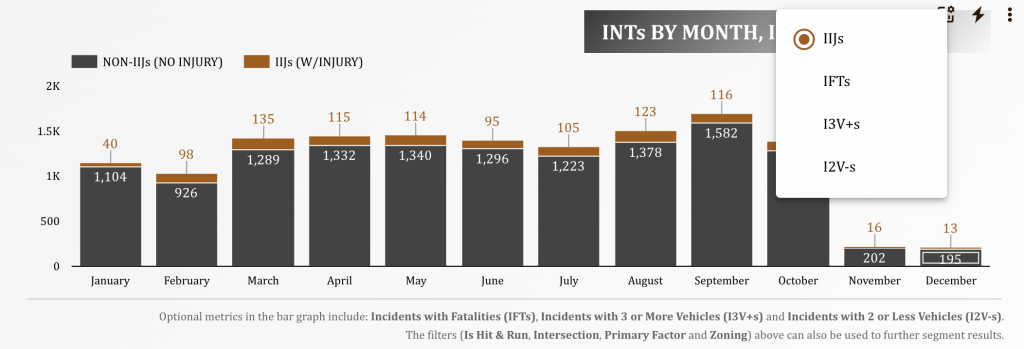
- Optional Metrics. These are graph-specific controls that allow the user to replace the default metric with another, by choosing the optional metrics selector on each graph. A list of what these metrics are can be found at the bottom of each graph. In the example below, optional metrics for the bar graph below include IFTs, I3V+s, and I2V-s.

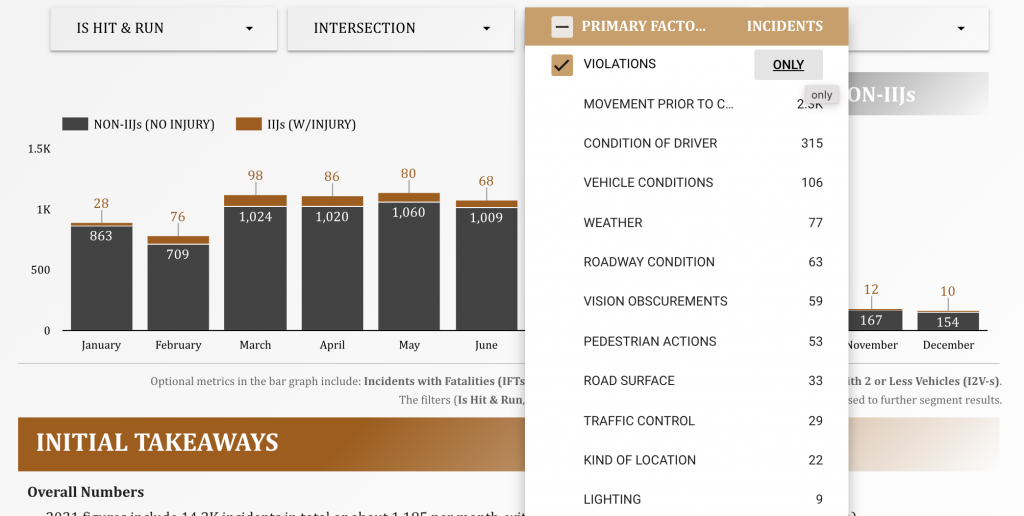
- Filters. These are page-specific controls that update the results in all the graphs within that page based on selected filter values. In the example below, choosing Violations updated the values of the bar graph to only include incidents that meet the Primary Factor filter criteria.

Report
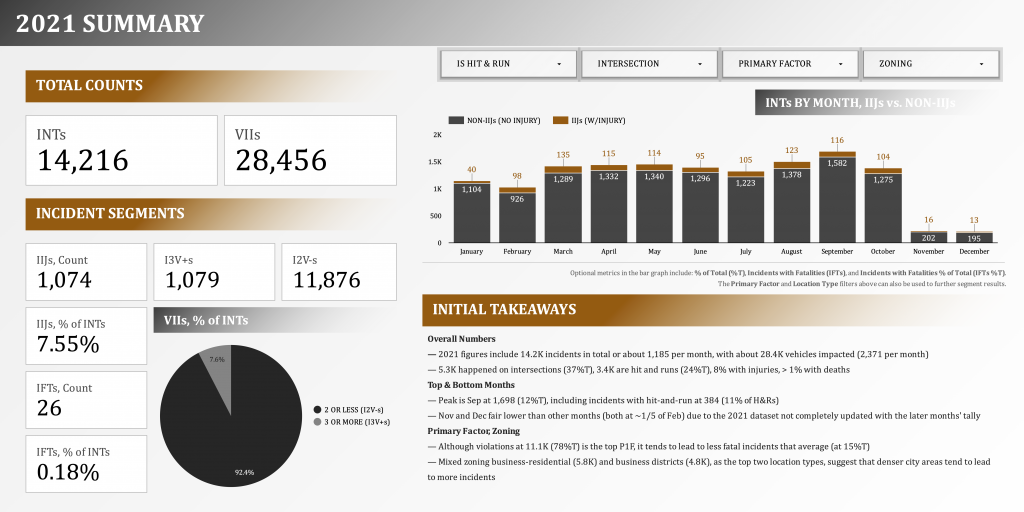
Below is a snapshot of the first page of the report. Please click the image to go to the dynamic dashboard.
